Chart Speed effects on Side Imaging and Down Imaging
Posted: Tue May 17, 2011 10:49 am
Here are some examples of the effects of not adjusting the Chart Speed to match the boat speed and how it can distort the data.
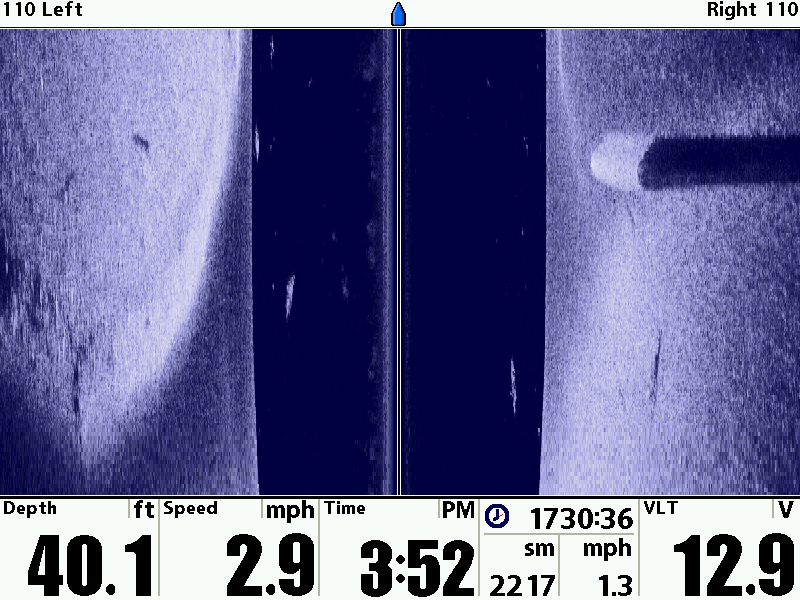
Chart Speed matching Boat Speed...see the details?
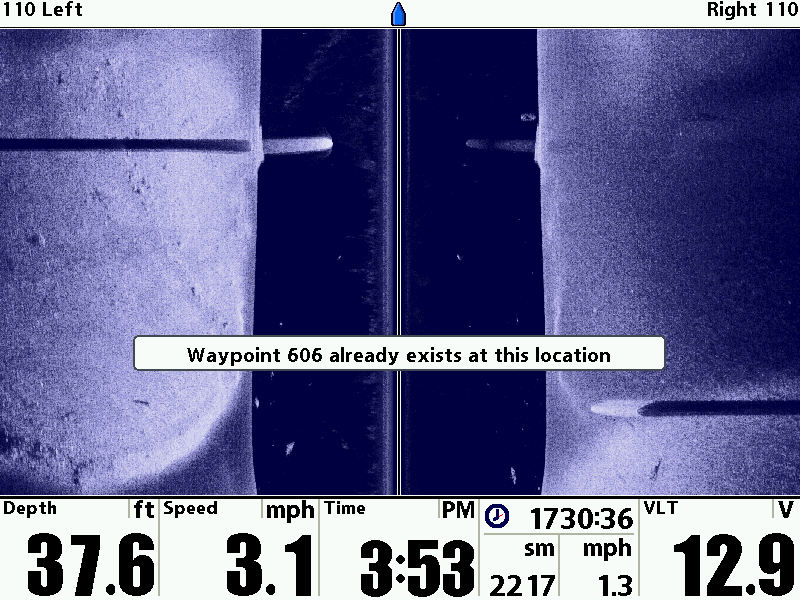
Now the Chart Speed increased and loss of resolution and stretching of data...
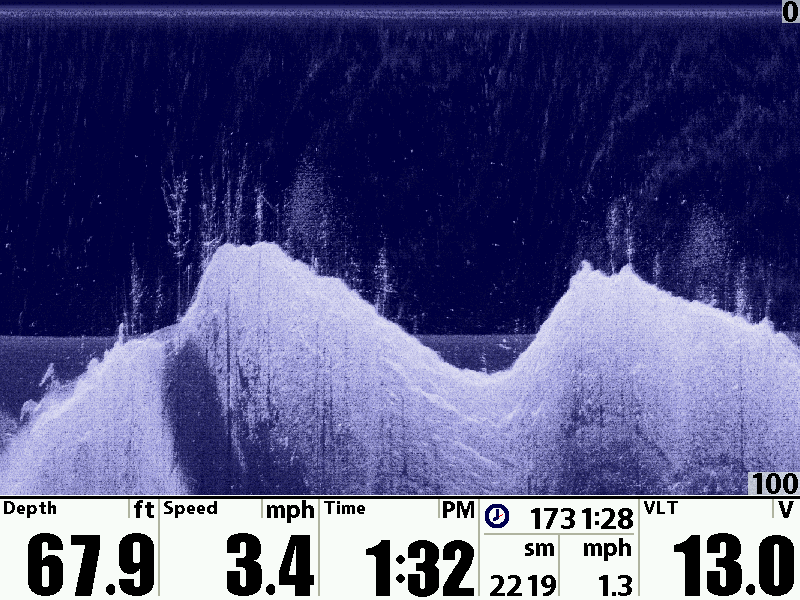
Same thing happens with Down Imaging...
Too Fast...
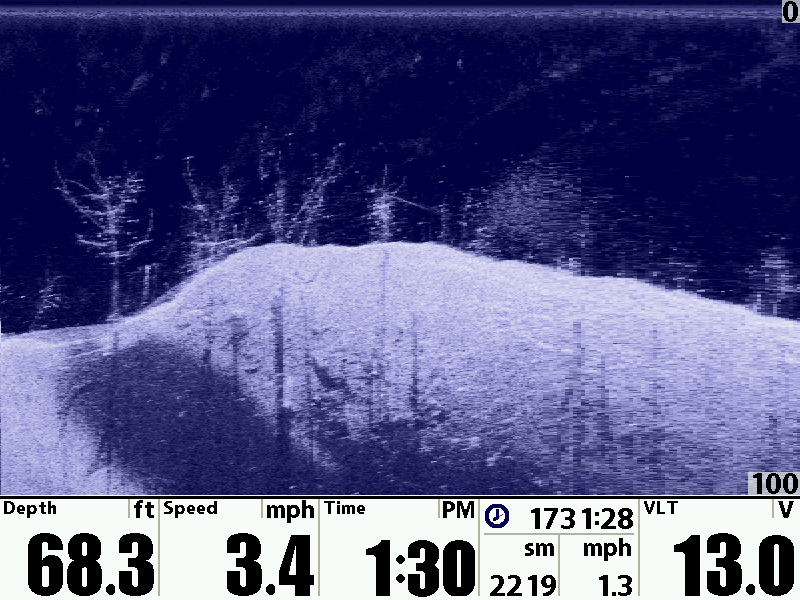
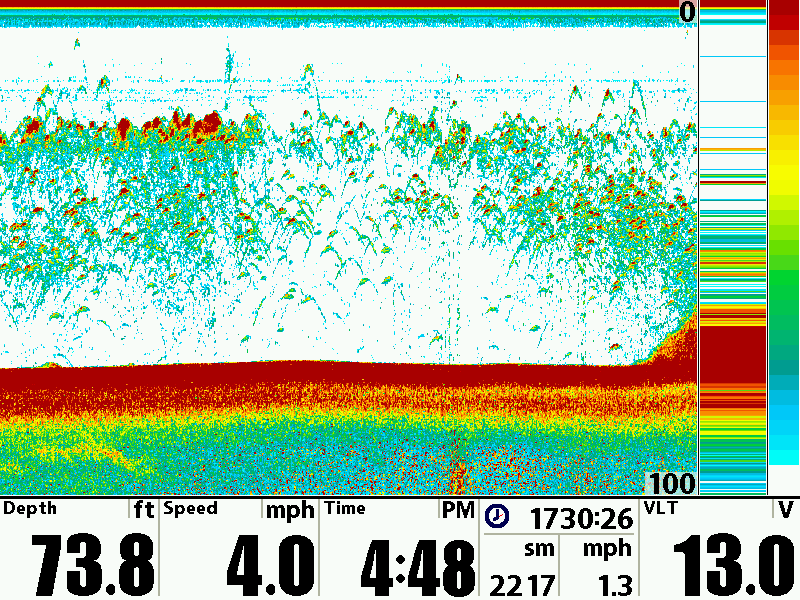
Still a little fast...
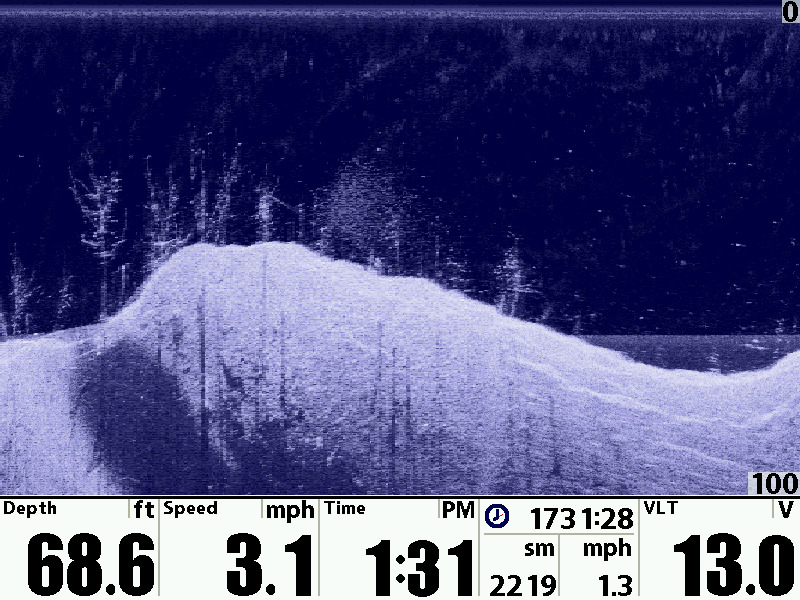
Just Right...
Now Switchfire 2D Sonar...
Matched to boat Speed...
Too Fast... (elongates returns)
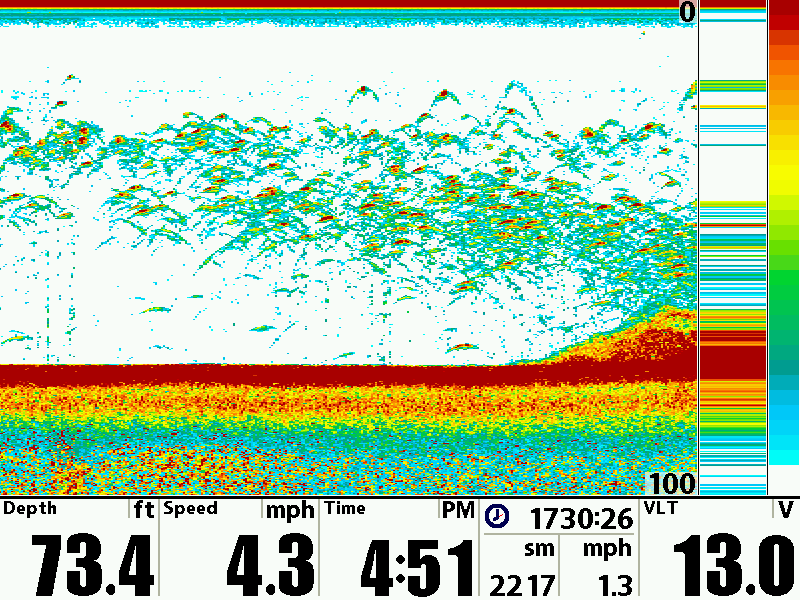
Adjusting your Chart Speed will help you get your images just like the images are naturally positioned under the water. To fast will stretch the images and too slow will shrink the data. Using the Chart Speed function is probably the Most Important element in creating picture perfect images. I try to match or drop a 1 number below chart speed for higher resolution images if you want to stretch them a little to see more separation of details adjust 1 or 2 numbers above boat speed but don't crank it up it will make the images lose alot of the resolution to the images.
Chart Speed matching Boat Speed...see the details?
Now the Chart Speed increased and loss of resolution and stretching of data...
Same thing happens with Down Imaging...
Too Fast...
Still a little fast...
Just Right...
Now Switchfire 2D Sonar...
Matched to boat Speed...
Too Fast... (elongates returns)
Adjusting your Chart Speed will help you get your images just like the images are naturally positioned under the water. To fast will stretch the images and too slow will shrink the data. Using the Chart Speed function is probably the Most Important element in creating picture perfect images. I try to match or drop a 1 number below chart speed for higher resolution images if you want to stretch them a little to see more separation of details adjust 1 or 2 numbers above boat speed but don't crank it up it will make the images lose alot of the resolution to the images.