

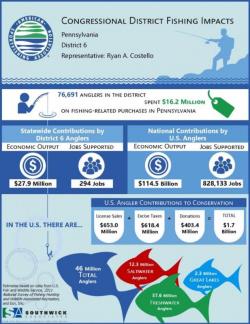
| New infographic pages are now available which depict recreational fishing's economic impacts on all 435 Congressional districts and the 50 states.American Sportfishing Association (ASA) and Southwick Associates have released a report, Economic Contributions of Recreational Fishing: U.S. Congressional Districts, Providing greater detail than ever before. In the U.S.A., 46 million anglers generate more than $48 billion in retail sales, creating a $115 billion impact on the nation's economy creating employment for more than 800,000 people. |
The information presented is from the U.S. Fish and Wildlife Services' 2011 National Survey of Fishing, Hunting and Wildlife-Associated Recreation, conducted in conjunction with the U.S. Census Bureau, as presented in ASA's Sportfishing in America report. The study details smaller geographic areas relevant to members of the U.S. House of Representatives. These reports can raise awareness among Members of Congress about the importance of recreational fishing in their state or district.
Recreational fishing is the foundation of an industry that involves manufacturing, sale or provision of tackle, and services such as tackle retailers, boat builders, hotels, restaurants. The results in Economic Contributions of Recreational Fishing: U.S. Congressional Districts report the economic contributions for the respective state economies from anglers who live within each of the congressional districts.
A Friendly Way to Track Trends:
Data Dashboards for State Agencies
Producing statistics and trend data is one thing, but actually getting them into the hands and heads of those who need them is a completely different challenge. For state fish and wildlife agencies who need the support of staff at all levels to effectively engage and retain customers, this has been a huge challenge over the years. Recent work in Oregon and other states shows there may be better ways to communicate and distribute vital statistics to agency staff: data dashboards.
The skills required to analyze and package data limit the number of people who are able to explore a state's license data, and, given the complex reports needed to convey findings, ensure customer trends and insights remain well-kept secrets. By using data dashboard tools such as Tableau, after one person first packages the data, all staff can then simply click boxes on the side of the screen to see trends and customer profiles. By making such key insights easy to access on demand, a greater percentage of agency staff will be on the same page, increasing the likelihood of implementing effective, science-based marketing strategies Plus, staff can quickly respond to inquiries about sales and customer trends. If you have questions about how data dashboards can be implemented in your agency, contact Rob Southwick (rob@southwickassociates.com).
 Advertising