

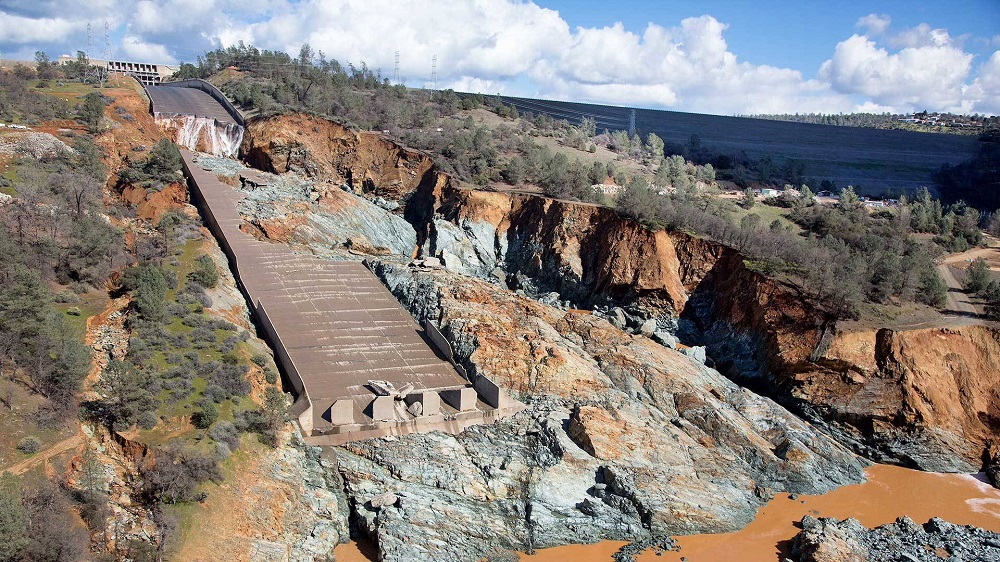
 Photo: 2017 | The damaged concrete main spillway at Oroville Dam. (CA Department of Water Resources) From KQED What Happened at Oroville Dam and What Could Still Go Wrong
The recent forum post on the shrinking size of Oroville bass sparked much discussion and has prompted me to look a little deeper into the tournament catch data available from DFG and share with everyone.
This data is what is published and shared through the Department’s tournament permit program. DFG conducts sampling – but that data is not published and is not readily available (and part of a whole other discussion). Tournament catch data will provide a reasonable metric from which to look at what may be occurring in Lake Oroville.
Several things have happened the past several years:
1) coho stocking ended in 2012 and Chinook salmon fingerlings were stocked in their place due to concerns about disease and genetics;
2) the slot limit was replaced with a simple minimum size limit; and
3) lingering significant drought followed by El Nino and a subsequent “flushing” of the reservoir to ensure sufficient capacity while repairs to the dam/spillway were completed.
Those are just the headlines – in the natural world where inter-annual variation continues and the fisheries go through their own cycles.
Following the Wild West Bass Team event on Lake Oroville – congrats to those who found and caught better fish – our friend TheFly posted a nice summation of his observations of fish size for WWBT team events over the past three years.
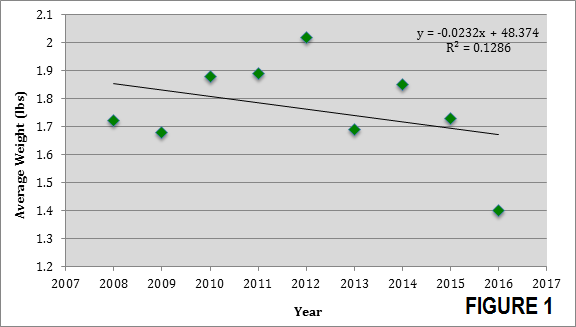
From that summation, there definitely appears to have been a decrease in average fish size the past three years.
Figure 1. Average fish size (weight in pounds) based on tournament catch data collected by tournament organizations and reported by DFG.
READ RELATED: California Anglers… Here is Why You are Incredibly Fortunate and Why You Should be Furious
 If we compare this to DFG’s data, average fish weight has also tended to decrease over time
However, DFG has not published their 2017 data yet and we are far from seeing 2018. If my qualitative observations of fish caught along with the tournament catch data thus far this year (NorCal 90 and WWBT), there certainly appears to be a trend towards smaller average fish size.
Unfortunately, the tournament catch data summaries do not provide big fish or any additional metrics by which to analyze the data. Further, DFG does not publish their data, so no way to look at size or age class distribution; however, the evidence available does appear to indicate a large single age class, which is becoming smaller.
There are numerous possible explanations for these observations and I’m going to propose a few potential reasons. These are intended to spark thought and discussion as I do not have sufficient data available to even begin to speculate causation.
The first is the increase in frequency and magnitude of annual reservoir fluctuations.
Last year –2017 – was a prime example when the reservoir crested above full pool then was subsequently drained to near record lows to protect against flood risk and allow for dam/spillway repairs.
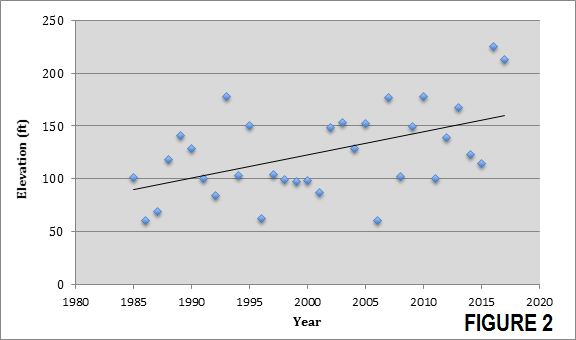
Figure 2 shows the difference in reservoir elevation annually from 1985 to present (i.e. the difference in the highest and lowest elevations for the calendar year). There is a clear increasing trend in the magnitude of annual swing in reservoir elevation.
Figure 2. Annual reservoir fluctuation, expressed as annual max less annual min pool elevation 1986-2017
There also appears to be an increase in the frequency of larger annual reservoir fluctuations (Figure 3). Thus – data suggest that reservoir fluctuations are becoming greater in magnitude the frequency of larger swings greater. There are numerous mechanisms by which these fluctuations can affect the fishery (spawning success, recruitment, predator/prey relationships, prey abundance, etc. etc.).
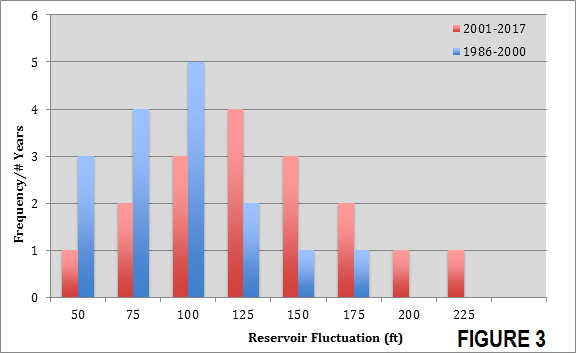
Figure 3. Frequency of occurrence of reservoir fluctuation magnitude for 1986-2000 and 2001-2017.
Coho were stocked into Lake Oroville for about 10 years, ending in 2012. These fish were primarily stocked as yearlings (~9”) but there were several years they were stocked as fingerlings (5”). Coho generally grew to about 13” at 18 months and 16” at 24 months.
Coho generally do not live as deep as the Chinook – and some, speculate because of this behavior, may have been more available to bass as forage.
Further, I speculate, that coho were more often driving bait shallower as well. I do not believe many coho were getting eaten when planted as yearlings – as mean fish size has remained relatively stable, however, they were certainly available for larger spots and largemouth, contributing to their growth potential, especially in years planted as fingerlings.
There are no data available to evaluate baitfish abundance in the lake – all we have is qualitative observations. I have personally seen fewer large concentrations of bait and certainly caught fewer bass puking up wakasagi all over my boat.
READ RELATED: Know Your Forage | Wakasagi
If wakasagi abundance has declined – there are also several possible reasons: reservoir fluctuation, spawning success and recruitment, Chinook are better predators, etc.
Additionally - when the pool is low – the baitfish populations are further constrained and presumably there is higher predation. This occurring more frequently – along with wider fluctuations (see notes below on reservoir fluctuation) may be affecting baitfish abundance and reduced bass growth. Given their life history, the significant loss of a single wakasagi year class would result in a precipitous decline in baitfish abundance and take several years to recover.
Amongst all these happening – there was a regulation change. Theoretically, if anglers were allowed to catch and keep fish in the 12- to 15-inch range (previously prohibited by the slot regulation) there would be fewer fish in this size/age class and allow for greater growth amongst the remainder.
I think a big problem is we have been programmed to always catch and release. We can all do our part – keep a few eaters (13-inchers) now and then. Having kept the slot regulation would not have made any difference.
Collectively – there is no “smoking gun” but a culmination of factors that are collectively contributing. Since bass are not a management priority for either the Department of Water Resources or DFG, it is not likely much will happen (and not much we can do).
Hopefully things will cycle and we see average size increase again. The silver lining is we are still seeing some good-sized fish and numerous largemouth mixed in.
Let’s hope we can get a few “normal” years of precipitation. In the interim – lets go fish Shasta and eat more fish tacos!
More on Northern California Forage by Mike Gorman
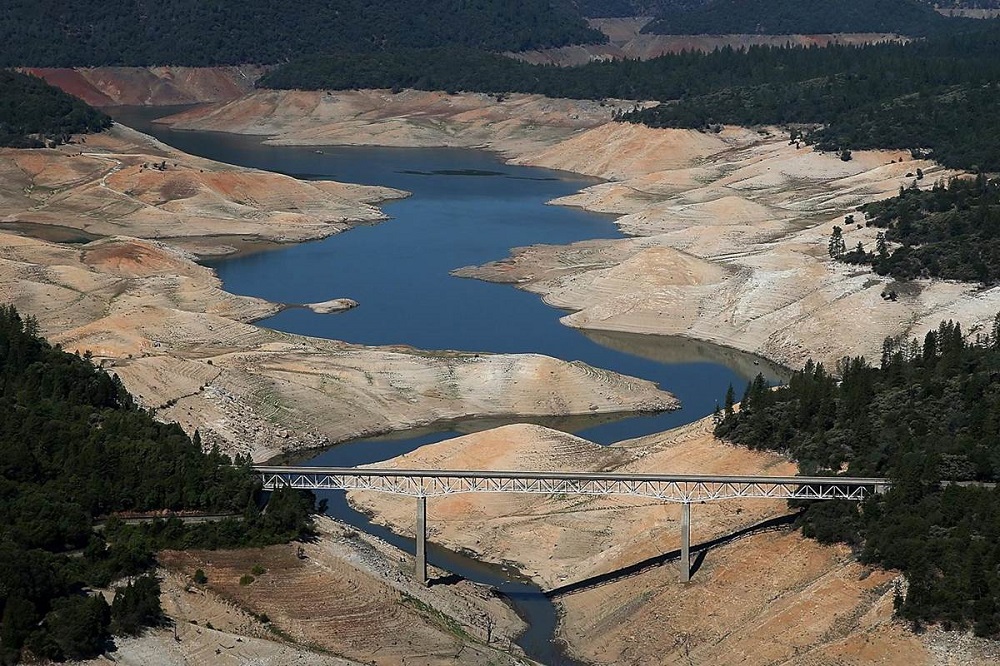
Photo: 2008 | Before Lake Oroville became so full that it overflowed the emergency spillway, the lake was a barren body of water that suffered heavily during the drought. This image was taken from a video by LiveCopter 3 in 2008 when water levels were extremely low.

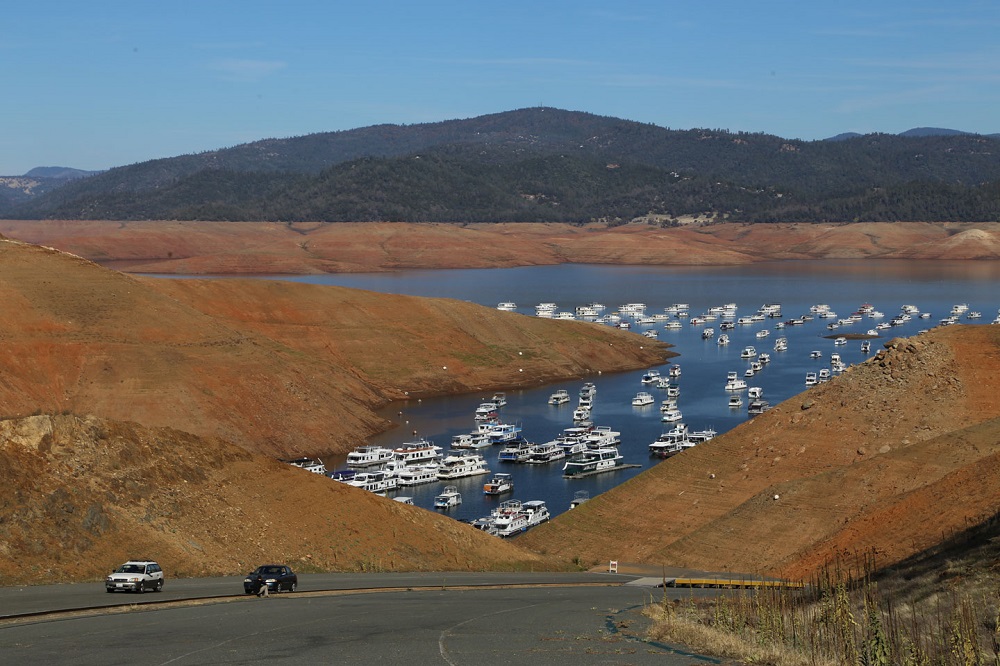 Photo: November 8, 2014 | Water surface elevation 652 feet above sea level; resevoir at 26 percent of capacity (Lisa Pickoff-White/KQED) More info and photos and KQED article
 Photo: 2017 | Oroville’s emergency spillway as the lake level topped it in February. Critical erosion of the slope below had not yet begun. (Calif. Dept. of Water Resources) From KQED What Happened at Oroville Dam and What Could Still Go Wrong
 Advertising